
One of the most widely used technical indicators in technical analysis is the Relative Strength Index. It measures the magnitude of recent price evolutions to evaluate if a price of an asset is overbought or oversold. In this blog post, I list the many ways you can calculate the RSI in Python.
🤓 Like stochastics, MACD, and ROC, RSI belongs to a group “loosely referred to as oscillators […] While the arcane names and imposing formulas of many oscillators may initially seem confusing, virtually all of these indicators are based on the concept of momentum, which, not surprisingly, refers to the rate (or speed) at which prices change.” Jack D. Schwager in Getting Started in Technical Analysis
The RSI was introduced by Welles Wilder Jr. in his 1978 book New Concepts in Technical Trading. However, there is no such thing as the relative strength index. There are many ways to calculate it. For each piece of code below, I’ll also discuss the methodological choices.
Calculate the RSI using nothing but Pandas
In the following code chunk, there is a function that you can use to calculate RSI, using nothing but plain Python and pandas. You pass the function a DataFrame, the number of periods you want the RSI to be based on and if you’d like to use the simple moving average (SMA) or the exponential moving average (EMA). By default, it uses the EMA.
import pandas
def rsi(df, periods = 14, ema = True):
"""
Returns a pd.Series with the relative strength index.
"""
close_delta = df['close'].diff()
# Make two series: one for lower closes and one for higher closes
up = close_delta.clip(lower=0)
down = -1 * close_delta.clip(upper=0)
if ema == True:
# Use exponential moving average
ma_up = up.ewm(com = periods - 1, adjust=True, min_periods = periods).mean()
ma_down = down.ewm(com = periods - 1, adjust=True, min_periods = periods).mean()
else:
# Use simple moving average
ma_up = up.rolling(window = periods, adjust=False).mean()
ma_down = down.rolling(window = periods, adjust=False).mean()
rsi = ma_up / ma_down
rsi = 100 - (100/(1 + rsi))
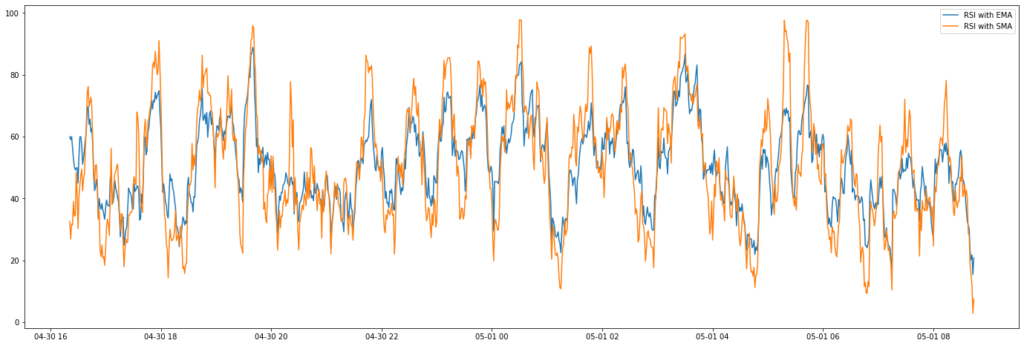
return rsiVisualized below is the difference in sensitivity between the RSI calculated with the EMA and the RSI calculated with the SMA. As you can see, there are more extremes if you use the SMA variant.

👀 Things to note regarding the ewm method:
- It is important that you use the min_periods parameter in the ewm method, in order not to calculate an RSI in the first periods of your time series, that is based on incomplete data.
- If you set the adjust parameter to True, a decaying adjustment factor will be used in the beginning of your time series. From the documentation: “Divide by decaying adjustment factor in beginning periods to account for imbalance in relative weightings (viewing EWMA as a moving average).
Calculate RSI using the TA-lib Python wrapper
✌ Installing TA-lib for Python can be somewhat of a nuisance, so please follow short my tutorial, especially if you use a custom notebook solution like Deepnote.
If you’re a fan of the widely used TA-lib library: good news! TA-lib supports the RSI out of the box.
import talib as ta

ta.RSI(df['close'], timeperiod=14)
TA-lib uses the same exponential moving average function as our custom function described earlier in this article. However, the first time it is calculated for a time series, it uses a simple moving average. That’s why it differs slightly at the beginning of our time series.
Calculate RSI using the pandas-ta library
Another convenient package for technical analysis in Python is pandas-ta. Just like TA-lib, it uses an EMA version. However, here too, in the beginning of the time series, it differs from the initial function provided in this article. That’s because it uses Wilder’s Moving Average.
import pandas_ta as pta

pta.rsi(df['close'], length = 14)
It comes with extra parameters such as:
- scalar: multiply the RSI by a specific scalar — maybe you like base 1000 or 1?
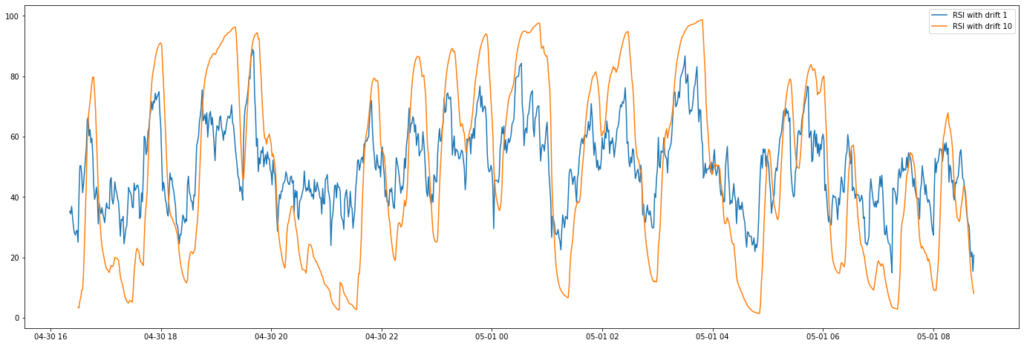
- drift: instead of using the difference in closing price at each period (drift = 1), you can use the difference in closing price between periods over a longer time period. In the example below, I compare pandas-ta’s RSI with drift set to 1 and 10.
Great success!